In 2026, finding the best server monitoring tools has become the backbone of every successful IT operation. Whether you manage hundreds of virtual machines, Kubernetes clusters, or multi-cloud workloads, your business reputation depends on proactive visibility into server health.
With AI-driven analytics, hybrid infrastructures, and DevOps automation transforming how we observe systems, selecting the right server monitoring tool is more critical than ever.
This comprehensive guide ranks the Top 10 Commercial (SaaS) and Top 5 Open-Source Server Monitoring Tools of 2026, comparing their features, pricing, scalability, and integrations. Each product has been evaluated for:
- Real-time metrics accuracy
- Alert management and automation
- Ease of deployment and integration
- Pricing value for different infrastructure sizes
- Support and community strength
Whether you’re an enterprise IT manager, a DevOps engineer, or a hosting provider seeking maximum uptime and security, this article will help you choose the right platform to monitor, analyze, and optimize your servers.
What is Server Monitoring Tools and Why It Matters in 2026

Server monitoring is the continuous tracking of system performance indicators CPU load, RAM usage, disk I/O, network latency, uptime, logs, and security events to ensure optimal availability and early issue detection.
In 2026, monitoring has evolved from static dashboards into intelligent observability: tools now combine metrics, logs, and traces with AI models to predict failures before they happen. This shift reduces downtime and lowers operational costs through predictive maintenance and automated alerting.
💡 Tip: Choose a tool that supports hybrid infrastructure (AWS + on-prem), AIOps, and multi-tenant dashboards if you run managed hosting or cloud services.
How We Choose the Best Server Monitoring Tools in 2026
Each tool on this list was evaluated based on five pillars of modern monitoring:
- Performance Metrics Depth – Granularity of CPU, RAM, I/O, bandwidth, and log data.
- Ease of Deployment – Agent vs agentless setups and integration speed.
- Automation & Alerting – Threshold rules, webhooks, incident response.
- Scalability & Pricing – Suitability for SMBs to large enterprises.
- Security & Compliance – Encryption, role-based access, audit logs.
Top 10 Best Commercial & SaaS Server Monitoring Tools in 2026
Below are the leading paid solutions trusted by enterprises and managed service providers worldwide. Each offers a different strength, cloud integration, user experience, pricing, or AI-based automation.
1. Site24x7 — Best All-in-One Monitoring for Hybrid Infrastructure
Site24x7, a Zoho Corporation product, stands out as one of the most comprehensive and scalable monitoring solutions in 2026. Designed for hybrid and multi-cloud infrastructures, it combines server, network, website, and application monitoring into one unified SaaS platform. From on-prem datacenters to Kubernetes clusters and AWS workloads, Site24x7 gives IT teams complete end-to-end visibility.
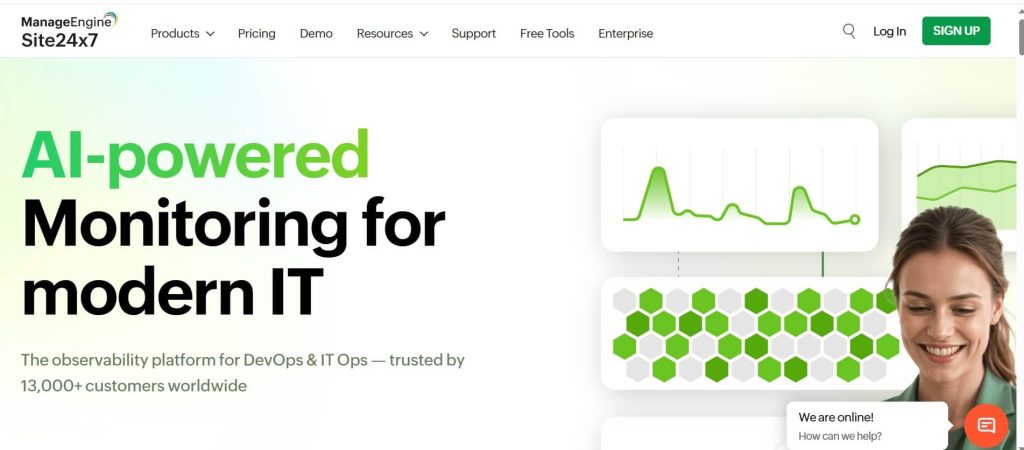
What makes Site24x7 unique is its deep integration ecosystem and AI-powered analytics. Using machine learning, it identifies unusual performance patterns, predicts outages, and automatically triggers alerts before downtime impacts users. It’s ideal for organizations operating complex environments spanning multiple cloud providers or global data centers.
Backed by the reliability of the Zoho enterprise ecosystem, Site24x7 integrates seamlessly with Slack, PagerDuty, AWS CloudWatch, Microsoft Teams, and Jira. Whether you’re a managed service provider, hosting company, or enterprise IT team, Site24x7 delivers unified observability with precision, speed, and automation, all in an easy-to-use interface.
Key Features:
- Unified Hybrid Monitoring: Manage on-prem, cloud, and containerized environments from a single intuitive dashboard.
- AI-Powered Anomaly Detection: Uses machine learning to detect performance deviations and trigger proactive alerts.
- Multi-Cloud Integration: Built-in support for AWS, Azure, GCP, VMware, and Kubernetes for seamless cloud visibility.
- Real User & Synthetic Monitoring: Measure real-world application experiences and simulate user journeys globally.
- Comprehensive Network Insights: Monitor routers, firewalls, switches, and WAN performance in real time.
- Custom Dashboards & Reports: Build detailed visual reports for SLA tracking, uptime history, and trend analysis.
- Mobile App & Instant Alerts: Receive live push notifications and manage incidents from iOS and Android devices.
| Pros | Cons |
| All-in-one observability platform covering servers, websites, and networks. | Feature depth can be overwhelming for small teams. |
| Intuitive UI with fast setup and over 100+ pre-built integrations. | Advanced customization requires a learning curve. |
| AI-based alerting drastically reduces false positives. | |
| Backed by Zoho’s global support and strong cloud infrastructure. |
Pricing: Starts at $9 per month per server (with free trial).
Verdict:
Site24x7 is one of the most complete and reliable monitoring platforms in 2026, blending enterprise-grade power with usability. It’s perfect for hybrid infrastructure monitoring, where uptime, scalability, and automation matter most. With its AI-powered analytics, real-time alerting, and extensive integration library, Site24x7 enables organizations to detect, diagnose, and resolve performance issues faster than ever making it the ultimate all-in-one server monitoring tool for growing IT ecosystems.
2. Datadog — Best for Cloud-Native and Enterprise Environments
Datadog continues to dominate the cloud observability landscape in 2026 with its AI-driven, full-stack monitoring designed for modern, distributed environments. Trusted by Fortune 500 enterprises and fast-scaling startups alike, Datadog provides unified visibility across servers, containers, applications, and logs from a single platform.
The platform integrates seamlessly with AWS, Azure, and Google Cloud, making it ideal for organizations running hybrid or multi-cloud infrastructures. Datadog’s customizable dashboards, deep analytics, and predictive alerts enable IT teams to optimize performance and quickly resolve issues before they escalate.
What truly sets Datadog apart is its AIOps and automation capabilities. It uses advanced machine learning to correlate thousands of metrics, detect anomalies, and reduce alert fatigue. For teams managing large-scale distributed systems, Datadog is the gold standard for reliability, speed, and actionable intelligence.
Key Features:
- Unified Observability Platform: Monitor infrastructure, logs, traces, and apps from a centralized SaaS dashboard.
- 600+ Prebuilt Integrations: Connect easily with AWS, Kubernetes, Docker, and CI/CD tools.
- AI-Driven Anomaly Detection: Machine learning identifies irregular patterns before outages occur.
- Real-Time Dashboards: Customizable, dynamic dashboards visualize key metrics instantly.
- Distributed Tracing & APM: Gain code-level visibility into microservices and transactions.
- Cloud Security Monitoring: Built-in compliance checks and threat detection for cloud workloads.
- Scalable Architecture: Designed for enterprises managing millions of metrics across regions.
| Pros | Cons |
| Best for cloud-native and enterprise-grade observability. | Can become expensive for high-metric environments. |
| AI-based root-cause analysis minimizes downtime. | Steeper learning curve for smaller teams. |
| Wide integration library and easy setup. | |
| Beautiful, data-rich dashboards. |
Pricing: Starts at $15 per host/month; free trial available.
Verdict:
Datadog is the most comprehensive and intelligent observability tool in 2026. With unmatched cloud integrations, AIOps capabilities, and visual analytics, it’s ideal for organizations seeking end-to-end visibility and automation. If scalability, reliability, and insight accuracy are your top priorities — Datadog delivers them all.
3. SolarWinds Server & Application Monitor (SAM) — Best for Enterprise IT Infrastructure
SolarWinds Server & Application Monitor (SAM) remains a powerhouse for enterprise-level monitoring. Designed to support hybrid infrastructures, SAM offers deep insights into servers, applications, and virtualization platforms, helping large IT teams maintain optimal uptime.
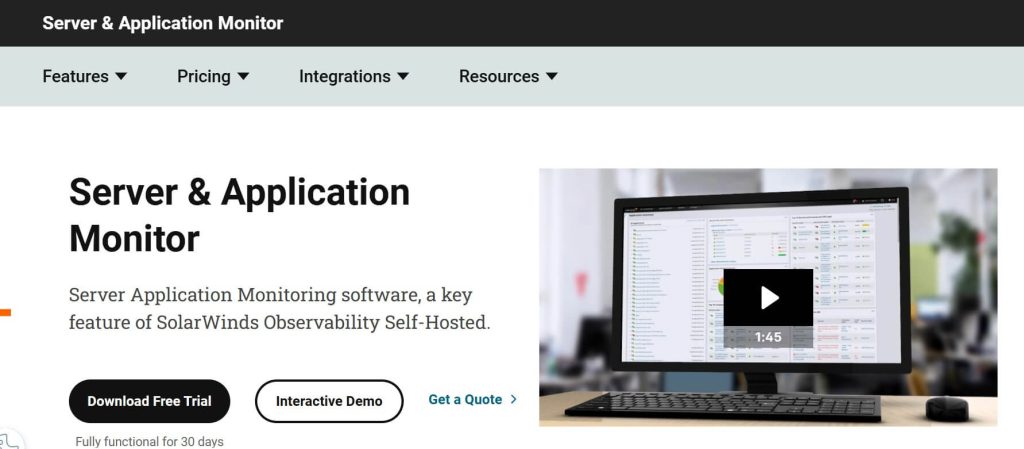
Its auto-discovery feature identifies servers, services, and devices across distributed networks. With customizable alerts, dependency mapping, and performance baselines, SolarWinds SAM ensures issues are detected early and resolved quickly.
In 2026, SolarWinds has refined its product with advanced visualization, improved API access, and tighter cloud integration. It’s a robust choice for IT administrators managing complex, mission-critical environments that demand reliability, scalability, and compliance.
Key Features:
- Cross-Platform Monitoring: Tracks Windows, Linux, and hybrid cloud servers seamlessly.
- Automated Discovery Engine: Scans and maps devices, applications, and dependencies automatically.
- Dynamic Dashboards: Provides customizable performance views for quick diagnostics.
- Virtualization & Cloud Support: Monitors VMware, Hyper-V, Azure, and AWS workloads.
- Intelligent Alerts: Prioritizes incidents using threshold-based smart notifications.
- Performance Baselines: Learns normal patterns and highlights abnormal server activity.
- Comprehensive Reporting: Generates SLA, uptime, and capacity-planning reports.
| Pros | Cons |
| Enterprise-grade performance monitoring and reporting. | More complex setup for smaller teams. |
| Excellent dependency mapping and alert management. | Higher cost than lightweight alternatives. |
| Scalable for large multi-site infrastructures. |
Pricing: Starts around $1,700 per year for 10 nodes.
Verdict:
SolarWinds SAM is the go-to choice for enterprise IT environments requiring in-depth server, network, and application visibility. With advanced alerting, comprehensive reports, and a proven track record, SAM ensures your entire IT ecosystem performs at its best — whether on-prem or in the cloud.
4. PRTG Network Monitor (Paessler) — Best for SMBs and All-in-One Monitoring
PRTG Network Monitor by Paessler remains one of the most user-friendly and feature-rich server monitoring solutions for small to medium-sized businesses. It offers a powerful “sensor-based” model, where each metric (CPU, memory, uptime, traffic) is monitored as an independent sensor for granular control.
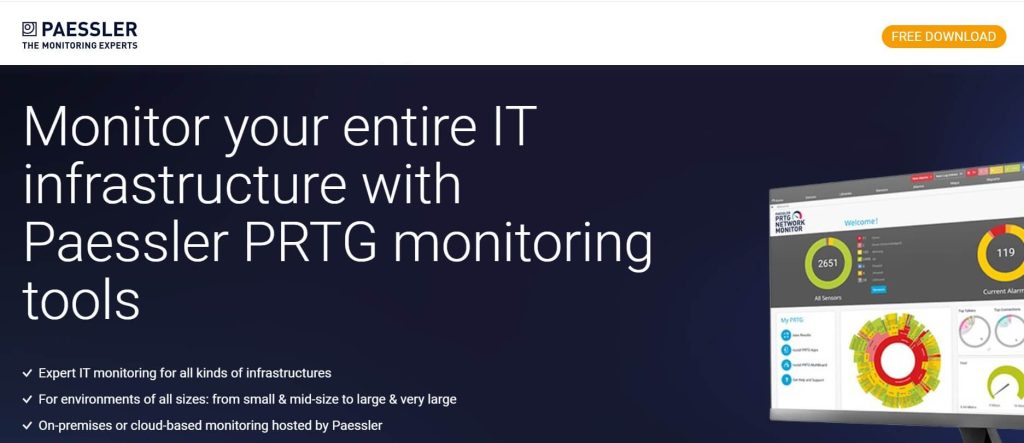
This approach allows precise customization and scalability while keeping costs predictable. PRTG provides real-time insights into servers, routers, databases, and virtual machines — all from a single dashboard.
In 2026, PRTG has added stronger remote monitoring, cloud integrations, and enhanced alerting. Its low setup time and intuitive interface make it the perfect choice for SMBs or IT managers managing diverse environments without enterprise complexity.
Key Features:
- Sensor-Based Architecture: Flexible and cost-efficient monitoring for servers, apps, and networks.
- Auto-Discovery Function: Automatically identifies connected devices and configures sensors.
- Integrated Alerts & Notifications: Supports email, push, and SMS alerts for instant action.
- Custom Maps & Dashboards: Visualize performance data with drag-and-drop widgets.
- Distributed Monitoring: Enables multiple probes across networks for redundancy.
- Cloud & Virtualization Support: Integrates with VMware, AWS, and Microsoft Azure.
- Comprehensive Reporting Engine: Exports historical data for SLA audits and trend analysis.
| Pros | Cons |
| Ideal for SMBs with flexible pricing and easy setup. | Limited Linux-native support. |
| Detailed metrics across physical and virtual environments. | Sensor count can impact cost on large deployments. |
| Reliable alerts and visual dashboards. |
Pricing: Free for 100 sensors; paid plans start at $1,799 per server.
Verdict:
PRTG Network Monitor offers enterprise-level monitoring simplified for SMBs. Its sensor-based model, intuitive design, and strong cloud integrations make it a one-stop solution for businesses needing reliable performance insights without high licensing costs.
5. LogicMonitor — Best for Managed Service Providers and Multi-Tenant Setups
LogicMonitor is a leading SaaS-based observability platform tailored for MSPs and enterprises managing multi-tenant or hybrid infrastructures. It delivers full-stack visibility through automated discovery, agentless data collection, and intelligent alerting.
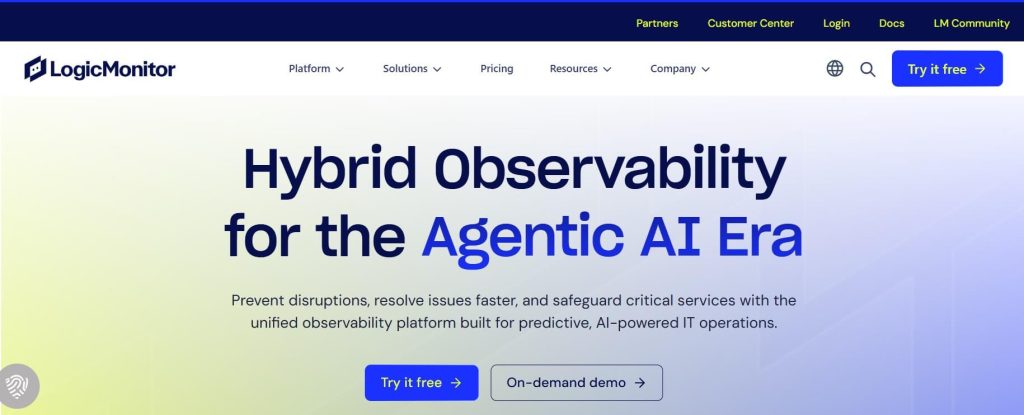
In 2026, LogicMonitor continues to enhance its AIOps capabilities with predictive analytics, automated baselines, and anomaly detection, reducing operational noise and alert fatigue for large-scale networks.
With built-in multi-tenant support, it’s a favorite among managed service providers and IT departments responsible for diverse client portfolios. Its scalability, automation, and API-first approach make LogicMonitor a premium choice for cloud-age infrastructure management.
Key Features:
- Agentless Data Collection: Monitors servers and devices via SNMP, WMI, and API without extra agents.
- Dynamic Auto-Discovery: Automatically identifies and maps network elements and dependencies.
- AIOps Intelligence Engine: Detects anomalies and predicts outages with machine learning.
- Multi-Tenant Dashboards: Allows MSPs to manage multiple clients securely in one interface.
- Cloud & Container Integration: Native support for AWS, Azure, and Kubernetes environments.
- Comprehensive API Access: Full automation for configuration, reports, and data exports.
- Custom Alerts & Thresholds: Reduces noise with adaptive alerting and event correlation.
| Pros | Cons |
| Perfect for MSPs and large enterprise environments. | Pricing is quote-based and premium. |
| Agentless setup simplifies deployment and scaling. | Advanced customization may need initial training. |
| AIOps reduces noise and improves uptime. |
Pricing: Custom pricing on request; free trial available.
Verdict:
LogicMonitor sets the benchmark for managed service providers and multi-tenant operations. Its intelligent automation, scalable design, and cloud integrations make it one of the best monitoring tools for hybrid infrastructures in 2026
6. New Relic — Best for Full-Stack Observability and Developers
New Relic remains a top choice for developers and DevOps engineers seeking code-level observability in 2026. It unifies infrastructure monitoring, APM, browser metrics, and synthetic testing into one seamless experience.
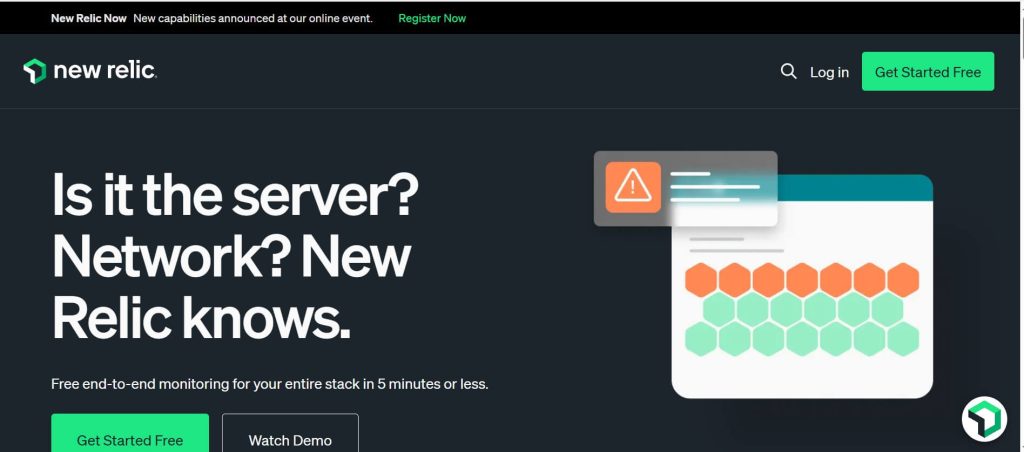
Its query language, NRQL (New Relic Query Language), provides deep insights into performance trends and anomalies. New Relic’s cloud-native design ensures scalability, flexibility, and rapid integration with CI/CD pipelines and modern microservice architectures.
Backed by a free tier and transparent pricing, New Relic appeals to both startups and enterprises looking to visualize everything from server uptime to user interactions — in real time.
Key Features:
- Unified Observability Stack: Combines APM, logs, and infrastructure metrics.
- NRQL Analytics Engine: Custom queries for advanced data analysis and dashboards.
- AI-Powered Alerts: Detects performance anomalies using predictive algorithms.
- Cloud-Native Integrations: Connects with AWS, GCP, Azure, and Kubernetes.
- Custom Dashboards: Tailor metrics to developer or executive needs.
- Free Forever Tier: 100GB data ingestion monthly with unlimited users.
- OpenTelemetry Support: Collect data from any source via open instrumentation.
| Pros | Cons |
| Developer-friendly with strong APM and analytics. | Can become data-heavy in large environments. |
| Unified dashboard for full-stack visibility. | Slight learning curve for NRQL beginners. |
| Transparent pricing and free tier availability. |
Pricing: Free tier available (100 GB data ingestion/month). Paid plans start around $49 per user/month.
Verdict:
New Relic is the most developer-focused monitoring solution in 2026. Its data-driven architecture and deep analytics help teams pinpoint bottlenecks instantly. For full-stack visibility, from backend servers to frontend user experience, New Relic is an unbeatable choice.
7. ManageEngine OpManager — Best for Network and Server Performance Monitoring
ManageEngine OpManager, another Zoho product, is a comprehensive solution blending server, network, and virtualization monitoring into one unified interface. It offers real-time performance tracking with intelligent alerts and automation workflows.
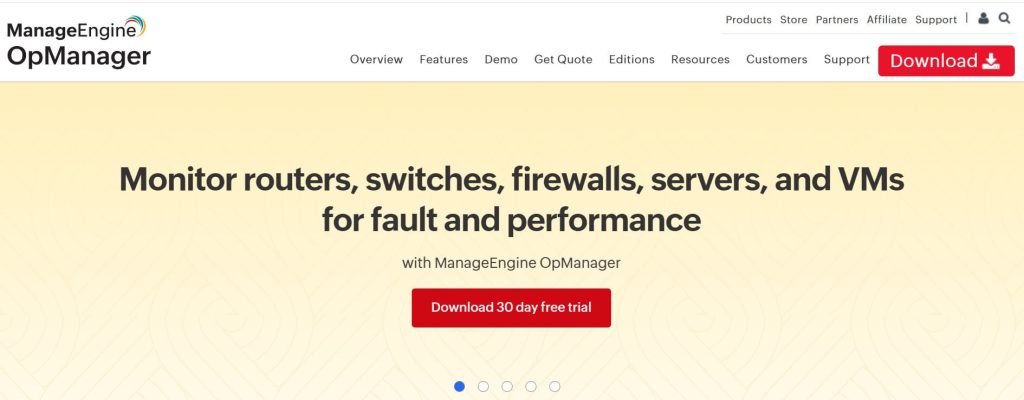
OpManager’s strength lies in its versatility. It supports both agentless and SNMP-based monitoring, integrates with major virtualization tools, and delivers deep insights into network bandwidth and system utilization.
In 2026, OpManager remains a top choice for enterprises and MSPs needing an on-prem alternative to SaaS monitoring tools while retaining powerful customization and automation capabilities.
Key Features:
- Hybrid Monitoring: Covers servers, routers, switches, and applications.
- Workflow Automation: Automates responses for frequent network events.
- Custom Dashboards: Build detailed performance dashboards via drag-and-drop.
- Advanced Fault Management: Multi-level alert escalation for faster response.
- Virtualization Support: Integrates with VMware, Hyper-V, and Citrix environments.
- Inventory & Asset Tracking: Maintains an updated record of connected devices.
- Extensive Reporting Suite: Provides SLA, trend, and availability reports.
| Pros | Cons |
| Unified view of network and server performance. | UI could feel slightly dated. |
| Automation reduces manual IT intervention. | Best suited for medium to large setups. |
| Affordable pricing for enterprise features. |
Pricing: Starts at $245 for 10 devices; perpetual licensing available.
Verdict:
A great fit for IT admins managing both on-prem servers and complex network topologies.
8. Nagios XI — Best Commercial Edition for Enterprise Environments
Nagios XI is the commercial evolution of the legendary open-source Nagios Core, offering enterprise-grade scalability, polished UI, and advanced analytics. It remains a trusted solution for large IT departments managing diverse infrastructures.
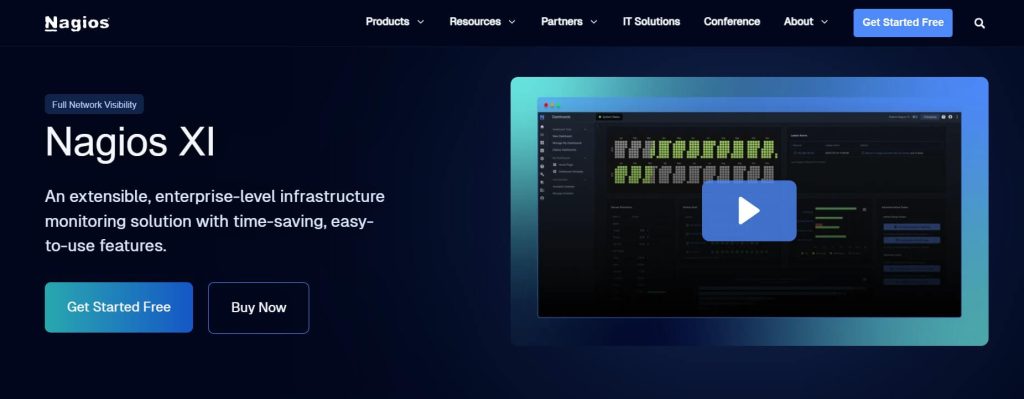
The platform features configuration wizards, automated discovery, and role-based dashboards for simplifying setup and management. Its plugin architecture allows thousands of third-party integrations, making it one of the most customizable tools on the market.
In 2026, Nagios XI continues to be a favorite among enterprises that value control, data ownership, and the reliability of time-tested monitoring architecture.
Key Features:
- Advanced Configuration Wizards: Simplifies device setup and monitoring creation.
- Role-Based Dashboards: Offers personalized views for teams and departments.
- Multi-Tenant Reporting: Manages multiple networks and business units securely.
- Comprehensive API Access: Automates monitoring and integrates with CI/CD pipelines.
- Enterprise Scalability: Supports thousands of nodes and metrics with ease.
- Custom Plugin Support: Extends functionality via community and enterprise plugins.
- Automated Alert Escalation: Prioritizes incidents for faster resolution.
| Pros | Cons |
| Proven stability in enterprise infrastructures. | UI feels dated compared to modern SaaS tools. |
| Thousands of community plugins and integrations. | Requires admin expertise for tuning large deployments. |
| Scalable and customizable architecture. |
Pricing: Starts at $1,995 for 100 nodes; perpetual license.
Verdict:
Nagios XI remains one of the most trusted commercial monitoring tools for enterprises seeking full control. Its stability, scalability, and rich plugin library make it ideal for complex infrastructures that demand reliability and flexibility in 2026.
9. Sematext Monitoring — Best for Modern Cloud-Native Observability
Sematext Monitoring is a modern, cloud-based observability suite offering infrastructure, logs, and uptime monitoring under one intuitive dashboard. It’s designed for DevOps and engineering teams seeking simplicity without sacrificing power.
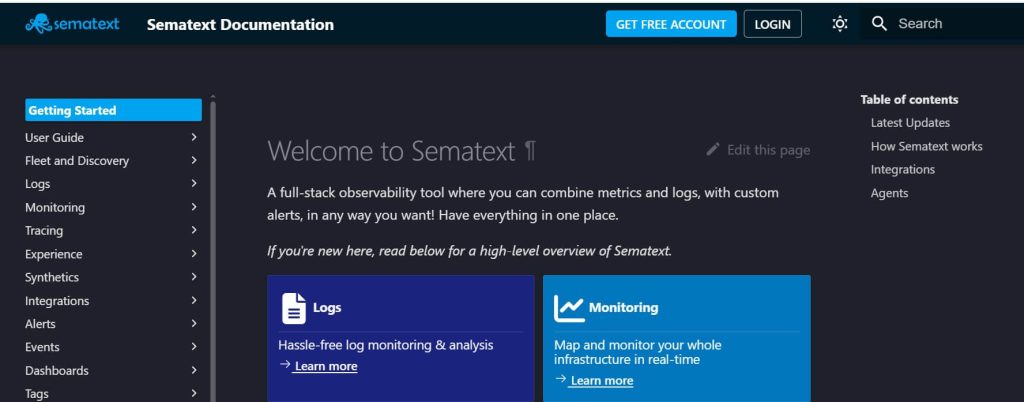
The platform’s lightweight agents and auto-discovery make setup fast and frictionless. In 2026, Sematext stands out for delivering affordable observability with AI-assisted insights and strong integrations for Docker, Kubernetes, and AWS.
Its pricing and ease of use position it as a strong Datadog alternative for smaller teams, startups, and SaaS businesses needing reliable cloud monitoring on a budget.
Key Features:
- Unified Observability Platform: Combines logs, metrics, and uptime checks.
- AI-Powered Insights: Detects anomalies and performance regressions instantly.
- Container & Cloud Support: Built for Kubernetes, AWS, and microservices.
- Smart Alerting Rules: Define custom thresholds with noise reduction.
- Team Collaboration Tools: Share dashboards and reports across departments.
- Affordable Pricing: Pay per host with transparent, flexible billing.
- Open API Integration: Connect easily with Grafana, Slack, and PagerDuty.
| Pros | Cons |
| Affordable cloud-native alternative to Datadog. | Limited advanced AI features compared to enterprise tools. |
| Simple setup and deployment. | Smaller plugin library than older competitors. |
| Excellent visualization and alerting features. |
Pricing: Free tier available; paid plans start at $3.60 per host/month.
Verdict:
Sematext Monitoring delivers top-tier observability at SMB-friendly pricing. With its clean UI, real-time metrics, and strong integrations, it’s the perfect choice for DevOps teams and SaaS providers who need performance insights without enterprise complexity.
10. Atera — Best for IT Service Providers and MSPs
Atera combines Remote Monitoring and Management (RMM), professional service automation, and ticketing into one complete SaaS platform. Designed specifically for IT service providers and MSPs, it simplifies monitoring, billing, and customer support within a unified portal.
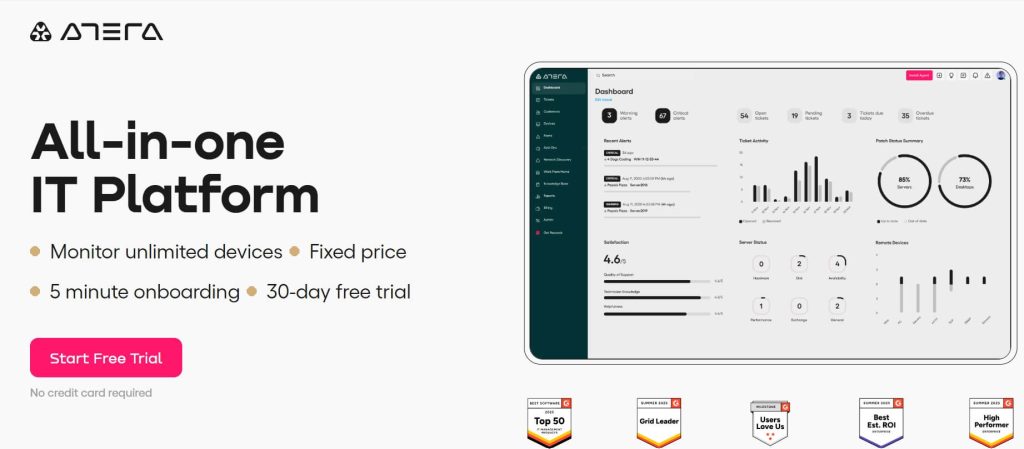
Unlike traditional per-device models, Atera’s pricing is based on per technician, allowing unlimited devices, making it highly cost-efficient for growing teams. Its real-time alerts, automated patch management, and remote access tools help MSPs manage entire client infrastructures effortlessly.
In 2026, Atera remains a leading solution for small to mid-sized MSPs looking for all-in-one efficiency with cloud scalability and automation.
Key Features:
- Real-Time Device Monitoring: Tracks server health, uptime, and endpoint performance.
- Remote Management Tools: Offers built-in Splashtop and AnyDesk integrations.
- Automated Patch Management: Ensures servers and endpoints remain secure and updated.
- Integrated Ticketing System: Simplifies support workflow for IT service providers.
- Per-Technician Pricing Model: Unlimited devices under a single subscription.
- Cloud-Based SaaS Platform: 100% cloud-hosted with zero maintenance, enabling access from anywhere, anytime.
- Smart Alerts & Automation: Automatically resolves repetitive IT issues and generates tickets instantly.
| Pros | Cons |
| Designed specifically for MSPs and IT service providers. | Limited in-depth analytics compared to enterprise-grade AIOps tools. |
| Unlimited device monitoring under per-technician pricing. | Some customization features require premium plans. |
| Includes RMM, patch management, and ticket automation. | |
| Fast, easy deployment with zero infrastructure overhead. |
Pricing: Starts at $129 per technician/month (unlimited endpoints).
Verdict:
Atera is the ultimate all-in-one platform for IT service providers and managed service companies in 2026. By merging remote monitoring, ticketing, and automation under one intuitive cloud dashboard, it streamlines operations and eliminates the need for multiple tools. Its per-technician pricing model offers unbeatable scalability, making Atera one of the best cost-effective monitoring and management solutions for MSPs worldwide.
Commercial Server Monitoring Tools Comparison Table (2026)
| Tool | Best For | Starting Price | Free Trial | Cloud / On-Prem | Notable Feature |
| Site24x7 | Hybrid & Cloud Infra | $9/mo | ✅ | SaaS | AI-driven anomaly detection |
| Datadog | Cloud-native & Enterprise | $15/host | ✅ | SaaS | 600+ integrations |
| SolarWinds SAM | Enterprise IT | $1,700/year | ✅ | Hybrid | Deep infra visibility |
| PRTG | SMBs & All-in-One | $1,799/server | ✅ | On-prem | Sensor-based pricing |
| LogicMonitor | MSPs / Multi-Tenant | Custom | ✅ | SaaS | AIOps automation |
| New Relic | Full-stack DevOps | $49/user | ✅ | SaaS | NRQL analytics |
| OpManager | Network + Server | $245/10 devices | ✅ | On-prem | Fault management |
| Nagios XI | Enterprise Infra | $1,995/100 nodes | ✅ | On-prem | Plugin flexibility |
| Sematext | Cloud-native Teams | $3.60/host | ✅ | SaaS | Log + metric integration |
| Atera | MSPs / SMB IT Teams | $129/technician | ✅ | SaaS | Remote monitoring + RMM |
Top 5 Open Source Server Monitoring Tools (Free) in 2026
Open-source server monitoring tools have always been the backbone of cost-effective IT operations. In 2026, the open-source ecosystem continues to dominate with enterprise-grade stability, cloud integrations, and community-driven innovation.
Unlike commercial tools, open-source solutions provide flexibility, customization, and zero licensing costs, perfect for DevOps teams, system admins, and hosting providers managing Linux or hybrid environments.
Below are the top 5 open-source server monitoring tools in 2026, based on reliability, scalability, and ecosystem strength.
1. Zabbix — Best Enterprise-Grade Open Source Monitoring
Zabbix is one of the most powerful and enterprise-ready open-source monitoring solutions available in 2026. It has earned global trust from IT departments, hosting providers, and large-scale enterprises for delivering real-time performance insights across servers, networks, and cloud platforms all without licensing costs.
The platform’s flexibility and extensibility make it ideal for hybrid and complex infrastructures. From monitoring CPU and memory usage to tracking application uptime and database health, Zabbix provides full-stack visibility that rivals many paid SaaS tools.
Its intelligent alerting and visualization dashboards help teams respond to incidents before they affect end users.
What truly sets Zabbix apart is its scalability and customization. With support for millions of metrics, integration with modern IT ecosystems (AWS, Azure, VMware, Docker), and advanced automation capabilities, it enables complete infrastructure observability while maintaining full control over data and configurations.
Key Features:
- Agent & Agentless Monitoring: Track physical and virtual servers through agents or agentless protocols for flexibility and coverage.
- Real-Time Metrics Collection: Collect and analyze performance data every second to identify bottlenecks before downtime occurs.
- AI-Driven Alerting Engine: Smart alerts use triggers and thresholds to detect issues instantly and send precise notifications.
- Customizable Dashboards: Build visual maps and charts to monitor CPU, memory, network traffic, and application performance live.
- Scalable Architecture: Supports thousands of hosts and millions of metrics with distributed monitoring across regions.
- Cloud & Virtualization Integrations: Seamlessly integrates with AWS, Azure, VMware, Docker, and Kubernetes environments.
- Security & SLA Reporting: Includes audit logs, user permissions, and SLA tracking to meet enterprise compliance standards.
| Pros | Cons |
| Completely free and open source with enterprise-grade functionality. | Requires manual configuration and setup for large deployments. |
| Highly scalable, supporting large and complex network environments. | User interface feels technical for non-admin users. |
| Extensive integrations and automation options for DevOps teams. | |
| Reliable alerting and performance visualization for 24×7 operations. |
Verdict:
Zabbix stands as a benchmark in the open-source monitoring world — combining power, scalability, and freedom. It’s the best fit for organizations seeking a robust, customizable solution to monitor hybrid environments without recurring costs. With its active community, enterprise-grade stability, and comprehensive metrics coverage, Zabbix is a long-term monitoring investment for serious infrastructure teams.
2. Prometheus + Grafana — Best for Cloud-Native & Kubernetes Monitoring
Prometheus and Grafana together form the backbone of modern observability in cloud-native ecosystems. This open-source duo is trusted by DevOps teams worldwide for delivering real-time visibility across Kubernetes clusters, microservices, and distributed infrastructures with unmatched flexibility.
Prometheus acts as a high-performance time-series database and metrics collection engine, gathering detailed performance data from servers, containers, and applications. Grafana, on the other hand, transforms this raw data into powerful, interactive dashboards that make performance insights instantly actionable.
In 2026, this combination remains the industry standard for open-source monitoring, offering scalability, modularity, and precision for developers and system administrators. It’s especially favored by organizations leveraging Kubernetes, Docker, and CI/CD pipelines, thanks to its integration capabilities and highly customizable dashboards.
Key Features:
- Time-Series Data Storage: Prometheus stores millions of real-time metrics efficiently using its powerful time-series database.
- PromQL Query Language: Enables advanced querying and data manipulation to uncover performance trends and correlations.
- Native Kubernetes Integration: Automatically discovers pods, nodes, and services to simplify cluster-level monitoring.
- Dynamic Grafana Dashboards: Offers beautiful visualizations with real-time metric updates and rich graph customization.
- Alertmanager System: Delivers rule-based alerts, grouping, and deduplication via email, Slack, or webhook integrations.
- Modular Exporter Framework: Supports 1,000+ community exporters for monitoring databases, servers, and applications.
- Open Ecosystem Compatibility: Integrates seamlessly with Loki (logs) and Tempo (traces) for full observability stacks.
| Pros | Cons |
| Perfect for containerized, cloud-native, and microservices environments. | Requires manual setup of multiple components (Prometheus, Grafana, exporters). |
| Modular design allows limitless customization and scalability. | Native log management is limited without integrating Loki. |
| Supported by a massive open-source community and plugin ecosystem. | |
| Excellent performance for real-time metric collection at scale. |
Verdict:
Prometheus + Grafana delivers the most flexible, transparent, and scalable monitoring solution for cloud-native infrastructures. Its deep integration with Kubernetes and vast exporter ecosystem make it ideal for DevOps, SREs, and hosting providers seeking full control over observability without vendor lock-in. In 2026, this open-source stack continues to set the global benchmark for reliability, visualization, and performance insights in modern infrastructure monitoring.
3. Icinga 2 — Best Nagios-Compatible Modern Monitoring
Icinga 2 is the modern evolution of Nagios Core, re-engineered to deliver faster performance, stronger scalability, and a fully API-driven architecture. In 2026, it stands as one of the most dependable open-source monitoring platforms for enterprises seeking deep visibility and automation without proprietary costs.
Built for today’s hybrid infrastructures, Icinga 2 seamlessly monitors servers, networks, databases, and applications across on-premises and cloud environments. Its clean configuration language, clustering support, and modern web interface make it far easier to deploy and maintain than legacy systems.
Thanks to its flexible REST API and strong community ecosystem, Icinga 2 integrates smoothly with automation tools like Ansible, Puppet, and Chef. This makes it a favorite among DevOps teams aiming for unified infrastructure management with real-time alerts, distributed monitoring, and SLA-driven reporting.
Key Features:
- High-Performance Core: Optimized event engine processes thousands of checks per second with minimal resource load.
- Cluster Monitoring: Built-in distributed setup allows redundant masters and satellites for large-scale environments.
- REST API Integration: Exposes all configuration and status data for seamless automation with DevOps pipelines.
- Icinga Web 2 Interface: Modern, customizable web UI for dashboards, alerts, and performance visualization.
- Rule-Based Notifications: Define flexible alert rules, dependencies, and escalation paths to reduce alert noise.
- Extensive Plugin Support: Compatible with Nagios plugins plus community extensions for databases and apps.
- Reporting & Visualization: Generate SLA, availability, and trend reports to track long-term infrastructure health.
| Pros | Cons |
| Modern replacement for Nagios Core with improved scalability and automation. | Initial setup and clustering can be complex for beginners. |
| Powerful API and integration capabilities for DevOps workflows. | Requires manual tuning for very large deployments. |
| Supports distributed and redundant monitoring architectures. | |
| Vibrant community and commercial support available. |
Verdict:
Icinga 2 successfully bridges traditional and modern monitoring approaches. It preserves Nagios compatibility while delivering an API-centric, scalable platform suited to enterprise-grade infrastructures. For organizations that demand open-source freedom with automation readiness, Icinga 2 is a rock-solid, future-proof solution offering reliability, customization, and full-stack visibility in 2026 and beyond.
4. NetData — Best Real-Time Server Performance Monitoring
NetData is a blazing-fast, open-source monitoring platform designed for real-time server performance visualization. Unlike traditional tools that focus on periodic polling, NetData captures metrics every second, giving system administrators and DevOps teams instant insights into CPU, RAM, I/O, and network behavior.
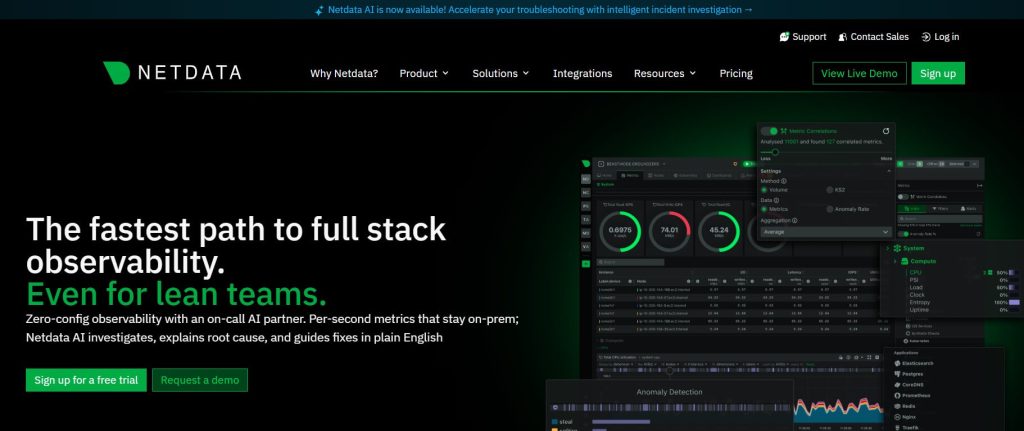
Its agent-based architecture is lightweight yet powerful, requiring minimal setup and zero configuration for most systems. Within minutes, you can monitor Linux, Windows, macOS, or containerized environments with interactive dashboards accessible from any device.
In 2026, NetData continues to stand out for its speed, simplicity, and visual precision. Whether you’re managing a single VPS or hundreds of nodes, its real-time analytics and cloud dashboard help detect bottlenecks instantly—making it a go-to choice for small businesses, hosting providers, and developers who demand rapid feedback and visibility.
Key Features:
- Real-Time Metric Collection: Captures system performance data every second for instant insight into server health.
- Zero-Configuration Setup: Installs in minutes with automatic detection of hundreds of metrics out of the box.
- Cross-Platform Support: Works on Linux, macOS, Windows, and Docker environments for unified monitoring.
- Interactive Web Dashboards: Offers live visualizations with dynamic charts, alarms, and color-coded thresholds.
- NetData Cloud Integration: Enables centralized management and collaboration across distributed nodes globally.
- Extensive Plugin Library: Monitors databases, web servers, containers, and IoT devices via plugin extensions.
- Lightweight Resource Usage: Consumes minimal CPU and memory, ideal for production and resource-limited systems.
| Pros | Cons |
| Real-time visualization with millisecond data refresh. | Not suited for long-term metric storage or enterprise-level historical analysis. |
| Simple installation and no complex setup required. | Limited correlation features compared to advanced observability stacks. |
| Minimal system resource consumption with cloud sync. | |
| Excellent for developers, SMBs, and self-hosted environments. |
Verdict:
NetData redefines simplicity and speed in open-source monitoring. With its instant installation, one-second data collection, and stunning dashboards, it provides an unmatched real-time view of system health. For developers, hosting providers, and small IT teams, NetData delivers lightweight, visual, and actionable monitoring—a must-have for those who value speed, clarity, and cost efficiency in 2026.
5. LibreNMS — Best for Network-Focused Server Monitoring
LibreNMS is a powerful, community-driven, open-source monitoring platform built to deliver complete visibility across servers, networks, and connected devices. It’s often seen as a free and open-source alternative to commercial tools like SolarWinds and PRTG, offering enterprise-grade performance without licensing fees.
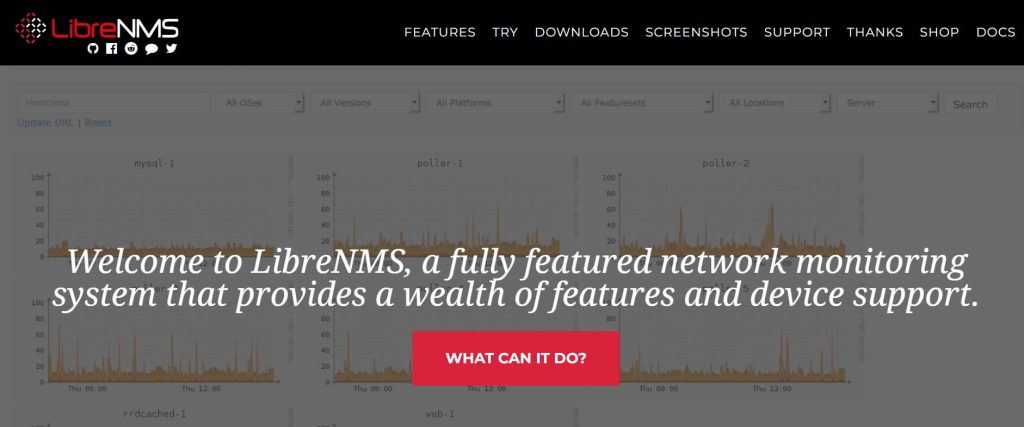
Developed in PHP and backed by an active global community, LibreNMS supports SNMP, autodiscovery, and API-based integrations to simplify monitoring for complex infrastructures. Whether you manage an ISP backbone or a multi-datacenter setup, it automatically detects network devices, assigns graphs, and begins tracking key performance metrics with minimal configuration.
In 2026, LibreNMS continues to dominate the network-monitoring segment among open-source solutions. With its mobile-friendly web interface, extensive plugin support, and compatibility with Grafana, Slack, and Telegram, it’s a top choice for sysadmins and hosting providers who value reliability, scalability, and transparency in monitoring.
Key Features:
- Automatic Network Discovery: Scans networks using SNMP and automatically adds devices, sensors, and graphs.
- Comprehensive Alerting System: Supports email, SMS, and chat notifications with flexible escalation rules.
- Custom Dashboards & Widgets: Create tailored views for bandwidth, uptime, and latency metrics in real time.
- Integration with Grafana & APIs: Exports data to Grafana or other tools using robust RESTful API endpoints.
- Responsive Web Interface: Clean, mobile-optimized interface for monitoring from desktops, tablets, or phones.
- Multi-User & Access Control: Define user roles, permissions, and audit trails for collaborative monitoring.
- Extensive Device Support: Monitors servers, routers, switches, and IoT devices across multi-vendor ecosystems.
| Pros | Cons |
| 100% free and open source with active community development. | Primarily network-focused; lacks deep application-layer visibility. |
| Ideal for ISPs, hosting companies, and enterprise network admins. | Requires Linux administration skills for setup and maintenance. |
| Supports automation and third-party integrations via APIs. | |
| Scalable architecture for thousands of monitored devices. |
Verdict:
LibreNMS is one of the most dependable and versatile open-source solutions for network and infrastructure monitoring. With automatic device discovery, API integrations, and strong alerting capabilities, it rivals paid platforms in reliability. In 2026, it remains the go-to free alternative for ISPs, datacenter operators, and DevOps teams who need scalable, transparent, and community-supported network observability.
Top 5 Open Source Server Monitoring Tools Comparison in 2026
| Tool | Best For | License | Deployment | Visualization | Scalability |
| Zabbix | Enterprise Infra | GPLv2 | Agent/Agentless | Web UI | High |
| Prometheus + Grafana | Cloud & Kubernetes | Apache 2.0 | Container / VM | Grafana Dashboards | Very High |
| Icinga 2 | Enterprise & DevOps | GPLv2 | Agent/Cluster | Web UI | High |
| NetData | Real-Time Monitoring | GPLv3 | Agent / Docker | Cloud UI | Medium |
| LibreNMS | Network Devices | GPLv3 | Agentless (SNMP) | Web UI | Medium |
Open Source vs Commercial Monitoring (2026)
| Feature | Open Source Tools | Commercial SaaS Tools |
| Initial Cost | Free | Subscription ($9–$49/month typical) |
| Setup Time | Manual / Technical | One-click deployment |
| Customization | High (config files, plugins) | Medium (limited by vendor) |
| Scalability | Depends on architecture | Effortless (SaaS scaling) |
| Support | Community / Forums | 24×7 Vendor Support |
| Integration | API-based (Prometheus, Zabbix) | Built-in (Datadog, Site24x7) |
| Best For | DevOps, Linux Admins | Enterprises, MSPs, Hybrid Cloud |
💡 Expert Tip:
Combine Prometheus + Grafana for container metrics with a commercial SaaS tool like Datadog or Site24x7 for global uptime tracking.
This hybrid setup gives you both flexibility and enterprise reliability at lower costs.
Top Use Cases of Server Monitoring in 2026
Server monitoring has evolved far beyond uptime checks. In 2026, it forms the backbone of reliability, cost control, and compliance across multiple industries.
| Use Case | Description | Recommended Tools |
| Cloud Infrastructure Monitoring | Observe workloads running on AWS, Azure, and GCP with AI-driven analytics. | Datadog, Site24x7, LogicMonitor |
| Hybrid and Multi-Cloud Environments | Unified dashboards across on-prem + cloud instances. | Site24x7, SolarWinds SAM |
| Kubernetes / Container Monitoring | Monitor pods, nodes, and microservices. | Prometheus + Grafana, Datadog |
| MSPs & IT Service Companies | Multi-tenant monitoring + billing. | Atera, LogicMonitor |
| Web & SaaS Applications | Track uptime, latency, and end-user experience. | New Relic, Sematext |
| Enterprise Data Centers | Deep visibility into servers, storage, and virtual machines. | SolarWinds SAM, ManageEngine OpManager |
| Network Monitoring & Security | Detect bandwidth abuse and unauthorized access. | LibreNMS, PRTG |
| Small Business / Hosting Providers | Affordable monitoring with automation. | PRTG, NetData |
How to Choose the Best Server Monitoring Tool in 2026
Selecting a monitoring solution in 2026 requires aligning budget, infrastructure type, and operational maturity.
Here’s a decision framework:
1. Define Your Infrastructure
- Cloud-Native / SaaS? → Datadog or New Relic.
- Hybrid Setup? → Site24x7 or SolarWinds SAM.
- Bare-Metal Servers or Data Center? → Nagios XI or Zabbix.
- Kubernetes / Containers? → Prometheus + Grafana.
2. Assess Scalability Needs
If you expect rapid growth, choose a tool with agentless collection and auto-discovery (LogicMonitor or Site24x7).
3. Consider Alert Fatigue
Look for AIOps capabilities that reduce noise by correlating related incidents (Datadog, Sematext).
4. Evaluate Integration Ecosystem
Confirm the platform connects to Slack, PagerDuty, Jira, and your CI/CD pipeline.
5. Balance Cost vs Control
| Preference | Recommendation |
| Full control / self-hosting | Zabbix, Icinga 2, LibreNMS |
| Pay-as-you-grow simplicity | Site24x7, Sematext, Atera |
| Enterprise SLAs & support | Datadog, SolarWinds, LogicMonitor |
💡 Pro Tip:
Combine one open-source monitoring system (for deep metrics) with a SaaS uptime checker (for global visibility).
Example: Prometheus + Datadog = Cost efficiency + Enterprise reliability.
Server Monitoring Trends in 2026
- AI-Driven Anomaly Detection
Tools now predict outages using machine-learning models that analyze historical metrics and logs. - Unified Observability Stacks
Consolidation of metrics, logs, and traces into single dashboards (e.g., Datadog, New Relic). - Edge and IoT Monitoring
Lightweight agents like NetData support edge servers and IoT devices for real-time telemetry. - OpenTelemetry Standardization
2026 sees mass adoption of OpenTelemetry for vendor-neutral data collection. - Security & Compliance Integration
Monitoring tools now include SIEM and vulnerability feeds for GDPR and HIPAA compliance. - Cloud Cost Optimization Insights
Modern dashboards correlate resource usage with billing data to reduce spend. - Self-Healing Infrastructure
Auto-remediation scripts triggered by monitoring events are becoming the norm.
Frequently Asked Questions (FAQ’s)
What is the best server monitoring tool in 2026?
The best server monitoring tools in 2026 are Datadog and Site24x7 for cloud and hybrid infrastructures due to their AI-driven analytics and automation. For open-source users, Zabbix and Prometheus + Grafana offer enterprise-level flexibility, real-time metrics, and community support without licensing costs.
Are there any free server monitoring tools for enterprises?
Yes, several open-source tools provide enterprise-grade monitoring completely free. Zabbix, Prometheus, Icinga 2, NetData, and LibreNMS offer advanced server metrics, alerting, and dashboard visualization without subscription fees, making them perfect for cost-sensitive IT teams and large organizations.
Which server monitoring tool is best for MSPs or service providers?
For managed service providers (MSPs), Atera and LogicMonitor are top choices in 2026. They feature multi-tenant dashboards, remote monitoring, automated alerts, and integrated billing systems, allowing MSPs to manage multiple clients efficiently from one centralized SaaS platform.
Can open-source tools match SaaS solutions in reliability?
Yes. When configured correctly, open-source tools like Zabbix and Prometheus + Grafana can match the reliability of SaaS solutions. They provide granular control and flexibility but require more maintenance, while SaaS tools like Datadog offer convenience, scalability, and managed infrastructure.
How often should I review my monitoring setup?
Review your monitoring setup every 6 to 12 months to ensure accuracy and performance. Regularly update alert thresholds, dashboards, and integrations as your infrastructure grows to minimize false positives and maintain proactive visibility into server health and uptime.
What metrics are most important to monitor?
The key server metrics to monitor include CPU utilization, memory usage, disk I/O, network latency, uptime, error rates, and application response time. These indicators help detect resource bottlenecks early, optimize performance, and prevent costly downtime across infrastructure.
Which tools offer AI-based alerting or AIOps features?
Modern tools like Datadog, LogicMonitor, and Sematext Monitoring integrate AIOps and machine learning to detect anomalies automatically. They reduce alert noise, predict potential failures, and improve incident response by correlating related events across servers, applications, and cloud environments.
What is the difference between server monitoring and application monitoring?
Server monitoring focuses on system resources like CPU, memory, and network performance, while application monitoring (APM) analyzes code-level transactions and user experience. Tools such as New Relic and Site24x7 combine both for complete infrastructure and performance visibility.
How do these tools ensure data security?
Leading monitoring platforms ensure data security through TLS encryption, role-based access control (RBAC), and compliance with SOC 2, ISO 27001, and GDPR standards. This guarantees that all collected performance data and logs remain private and protected from unauthorized access.
What is the future of server monitoring beyond 2026?
The future of server monitoring lies in AI-powered observability, serverless monitoring, and self-healing automation. Tools will use predictive analytics to anticipate failures, integrate with cloud-native ecosystems, and deliver intelligent insights that enable zero-downtime infrastructure management.
Conclusion — Final Verdict & Top Recommendations
The Best server monitoring landscape in 2026 is a blend of automation, AI, and open-source innovation. No single tool fits every organization, the right choice depends on your infrastructure, team size, and budget.
Top Commercial Recommendations
| Goal | Tool | Why Choose It |
| All-in-One Hybrid Monitoring | Site24x7 | Unified view of servers, apps, and web performance with AI anomaly detection. |
| Cloud & Enterprise Visibility | Datadog | Deep cloud integration + AIOps capabilities. |
| Best for MSPs & Multi-Tenant Ops | LogicMonitor / Atera | Scalable multi-client observability and automation. |
Top Open-Source Recommendations
| Goal | Tool | Why Choose It |
| Enterprise-Grade Free Solution | Zabbix | Feature-rich and scalable for large networks. |
| Cloud-Native DevOps Monitoring | Prometheus + Grafana | Industry-standard combo for Kubernetes and microservices. |
| Lightweight Real-Time Insights | NetData | Simple installation and 1-second metric refresh. |
As IT environments become increasingly hybrid and dynamic, server monitoring has evolved from simple uptime checks into intelligent observability ecosystems. In 2026, the focus has shifted toward AI-driven insights, automation, and predictive analytics that empower teams to act before downtime occurs.
Whether you’re managing dozens of VPS instances or large enterprise clusters, having the right monitoring tool is now a strategic advantage not a luxury.
For most organizations, the sweet spot lies in combining commercial SaaS platforms like Datadog, Site24x7, or LogicMonitor for scalability and automation, with open-source tools like Zabbix or Prometheus + Grafana for granular visibility and control.
This hybrid approach not only reduces costs but also strengthens redundancy, ensuring you maintain high uptime and fast issue detection across all infrastructures.
Ultimately, the best server monitoring tool in 2026 is the one that aligns with your goals — whether that’s deep cloud observability, real-time performance metrics, or multi-tenant MSP management. Start with a platform that fits your current needs, then scale as your infrastructure grows.